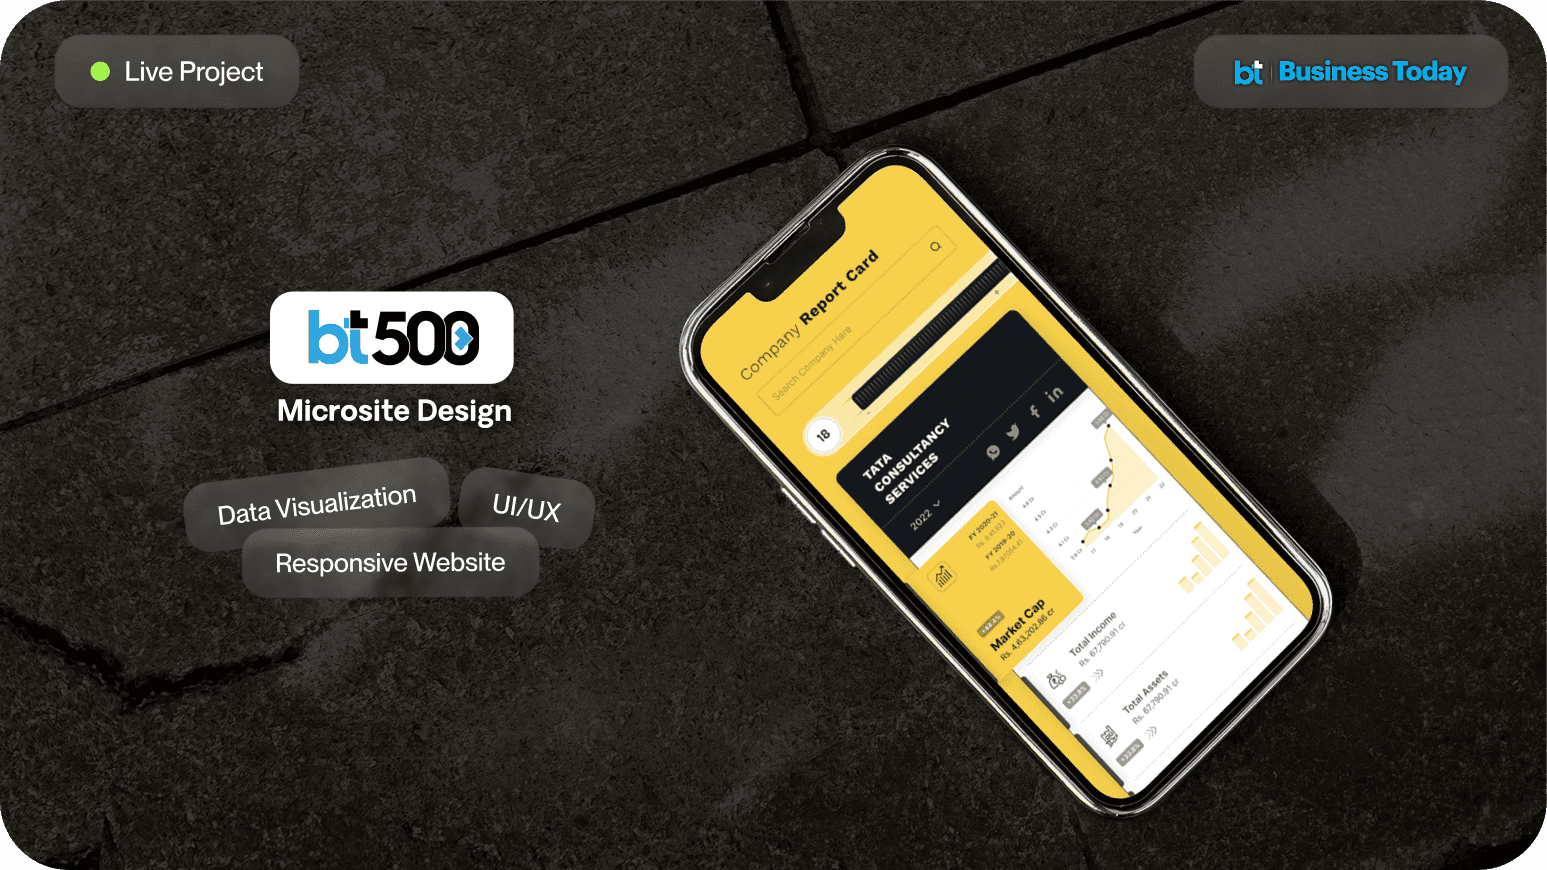
LIVE PROJECT
DATA VIZ
WEBPAGE
RESPONSIVE
BT500 for Business Today:
National Businesses Report Card

About
BT500 is compiled by Business Today (India Today Group) which annually ranks India's top 500 companies on multiple key metrics, offering insights into the nation's corporate landscape.
My Role
Conceptualizing, Data Viz,UI/UX Design, Prototyping, Dev- Handoff
Timeline
2.5 weeks (Dec. 2022)
Team
Design: Shiksha Singh, Surbhi Sonway
Development: Harmeet Singh, Pankaj Negi
Data & Method: Prince Tyagi, Rahul Oberoi
Producer: Piyush Aggarwal
TLDR;
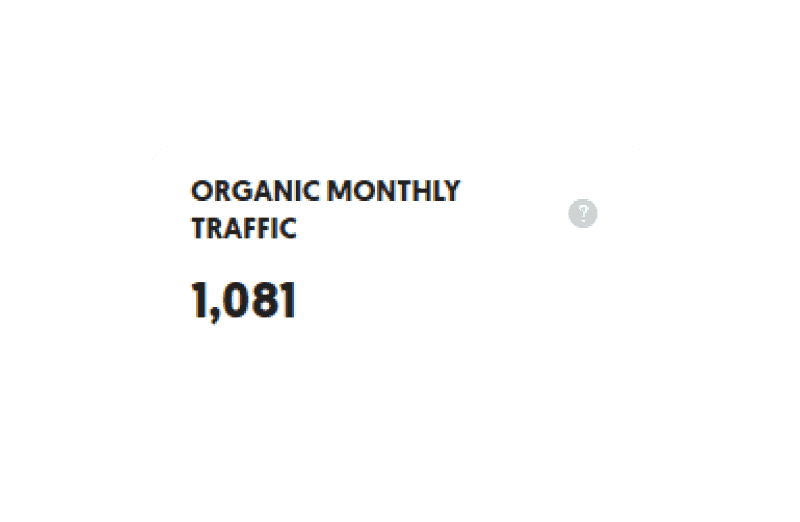
I collaborated with Business Today (India Today Group) to redesign their BT500 Microsite. The project was successful and increased its organic traffic by 23% on its relaunch.

Overview
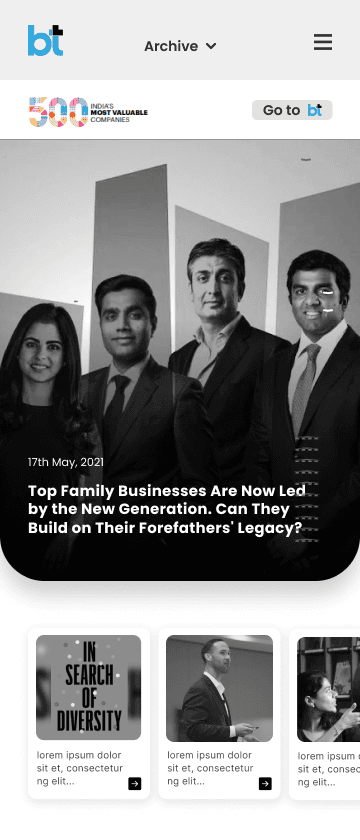
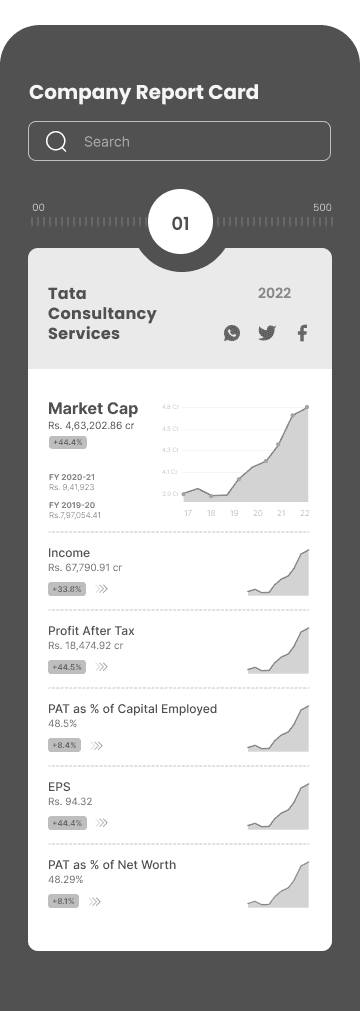
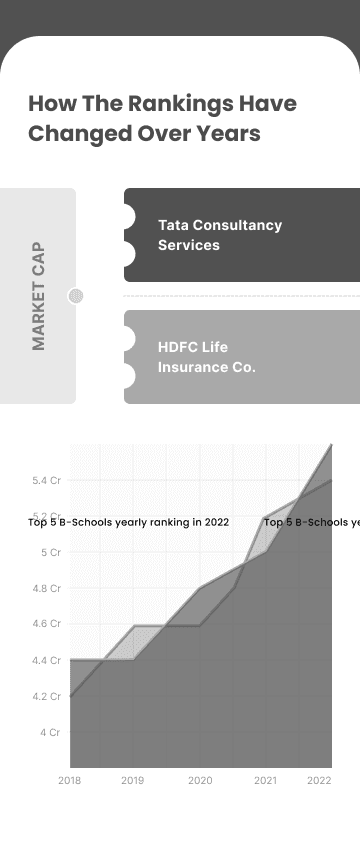
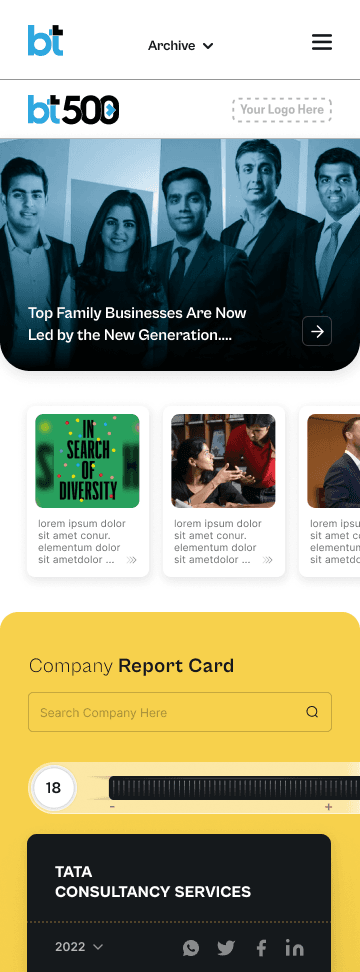
BT500 is a responsive microsite with engaging data visualizations for top 500 businesses and their annual report cards to evaluate their performance throughout the year.

Prerequisites
What were we working with?
Excel sheets with intensive and intimidating research & the older website were provided to us as a reference by the Producer, Piyush Aggarwal.
The redesign of the BT500 microsite 2015 version was essential; a more responsive and user-friendly interface.
We ensured that the focus was on streamlining the site's structure and ensuring a seamless and efficient experience for visitors

Prerequisites
Redesign the "Window"
Majority of the users engage with the via phone so it has to be a responsive (mobile-first) Interface. BT500 is an event that is conducted annually and the last time it was held was in 2015 with outdated visuals and more importantly, user friendliness.
So it’s essentially a revamp.

Archetypes
The ICPs were already provided to us;




Design Goals
Client's Needs
Before proceeding, We had a heart to heart with the clients to understand what expectations expectations are.

Straightforward
“No confusing patterns, just easy access to data where it’s needed”

Contemporary
“Aesthetically sound and visually engaging, introduce visual stories”

Phone First
“Everybody engages more via phones than desktop- legibility shouldn’t be compromised”

Reliable & Credible
“Backed by researchers, Should feel like a part of business today; also a designated space for ads”

Crisp data,
at a glance
“Data should be short and sweet- like desert!
easy to grasp at a glance.”

Process
Data Relationship to sync with Target Groups' goals
Users
Narrative
Data
BT500

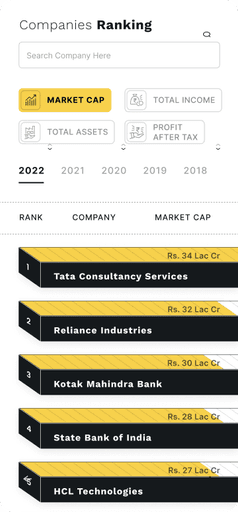
Ranking

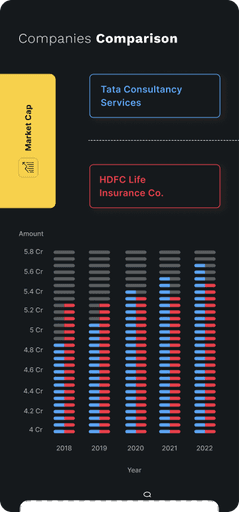
Comparison

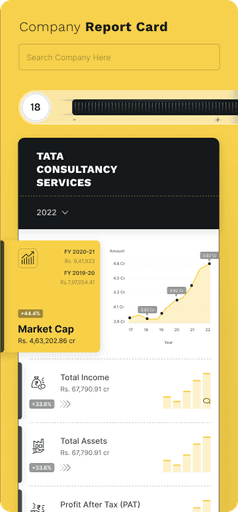
Interrelation

Iterations

Mobile Design


Iconography
MARKET CAP
TOTAL INCOME
PROFIT AFTER TAX (PAT)
ASSETS
PAT MARGIN
PROFIT % OF NET WORTH
PROFIT % OF CAP EMPLOYED
HE
CHAN
E
WE BROUGHT?

Deliverables
Here's what all we delivered
Hand off Files
Coherent component library
Icon Library
There was an overwhelmingly positive response from both the India Today Group and the Users.
so basically,
I love
about design
© Copyright 2024. All rights Reserved.


